Article
How visual analytics is helping Chick-fil-A serve up more chicken, meet customer needs
Chick-fil-A is using Tableau’s interactive data visualization technology to make better, faster decisions that will lead to increased revenue and higher customer satisfaction.
January 25, 2019 by Judy Mottl — Editor, RetailCustomerExperience.com & DigitalSignageToday.com
 ChatGPT
 Grok
Grok Perplexity
 Claude
Chick-fil-A is in the business of selling chicken but its prime ingredient for making that happen is data — data about customers, data about sales, data about menu items, data about customer traffic — and using data to make faster, better and more intelligent decisions.
The knowledge of how important data is driving sales, boosting customer service and deepening customer loyalty isn't new at all. Fifteen years ago, the brand was busy collecting, parsing and analyzing relevant data to create an indepth monthly report using Microsoft Excel and Access tools. It was a time-consuming and labor-intensive monthly process to get data into the hands of executives and operators.
Today it's using Tableau interactive data visualization tools, focused on business intelligence, to generate real-time, more expansive data and, more importantly, data that is more relevant. The ability to access relevant data quickly is helping to drive revenue, sales and an enhanced customer experience, just as it's even helping to shorten customer wait times.
That's because while data is great to have for decision making, "meaningful insight and getting that to the right people at the right time," is crucial to brand success, according to Karen Hinson, lead analyst, reporting performance team at Chick-fil-A.
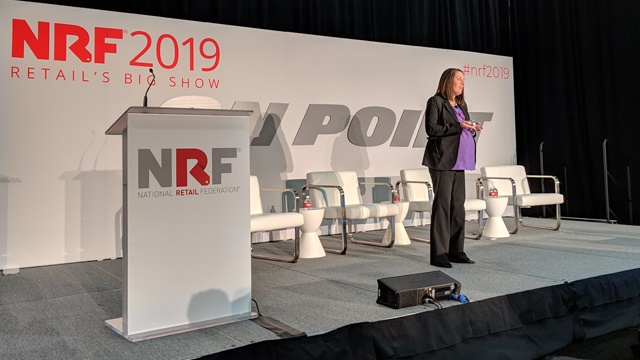 Hinson shared the brand's journey from Excel/Access to Tableau's technology during a panel session on Sunday, Jan. 13, the first day of the three-day National Retail Federation Big Show conference held at the Javits Center in New York City. The session was moderated by Jeff Huckaby, global segment director, retail and consumer goods at Tableau, which sponsored the talk.
The Tableau products can pull in data from relational databases, online analytical processing cubes, cloud database and even spreadsheets to generate needed graphs and charts, as well as creating an analytics dashboard.The tools can also extract data and store and retrieve from an in-memory data engine. Over 85 percent of the top 100 retailers and over 8,000 retail and consumer goods companies worldwide are using Tableau to help them understand their data and take action, according to the company.
Data faster and easier
At Chick-fil-A, which has 2,000 locations and did $10 billion in revenue in 2018, the Tableau dashboard automates steps necessary to generate reports, as well as updating dashboards to get information into the hands of those who need it, when they need it, explained Hinson.
"Users can filter data quickly and customize the data so that they see exactly the data they are interested in, every time they log in," she said, adding that dashboards are available to all staff and pull several new dimensions of data. "It's about leveraging data to make faster and better decisions."
As she acknowledged, the brand sells chicken sandwiches and is typically not viewed as a data-driven company. But it is today, she said, and everyone from the C-suite to the frontline in stores is focused on using the data to drive sales and boost the customer's experience.
The company is tracking trends from paper to wages to food — any data point the company needs in order to make the right business decision.
Gone are the days where the analyst team spent an entire day building the monthly database to track check averages and other restaurant metrics.
"It was a complicated and time consuming manual process within the enterprise, intense gathering of data," said Hinson, adding the manual approach was one in which it was easy to make mistakes and prone to delays. And, she noted, there was no real security built in to protect the sensitive corporate data.
Even the brand's annual report — a crucial document — proved expensive to create and inefficient in terms of real-time decisionmaking value as it took a month to pull together.
Fostering a better customer experience
Today Chick-fil-A leaders, operators and staff have real-time data and a much larger scale of metrics with a few clicks. Every Monday morning everyone gets a "snapshot" of current metrics as well.
"There's a big picture dashboard for executives and leaders, (with) nightly key info, specific metrics a chief operating officer needs every day. And everyone sees what the COO sees," she said.
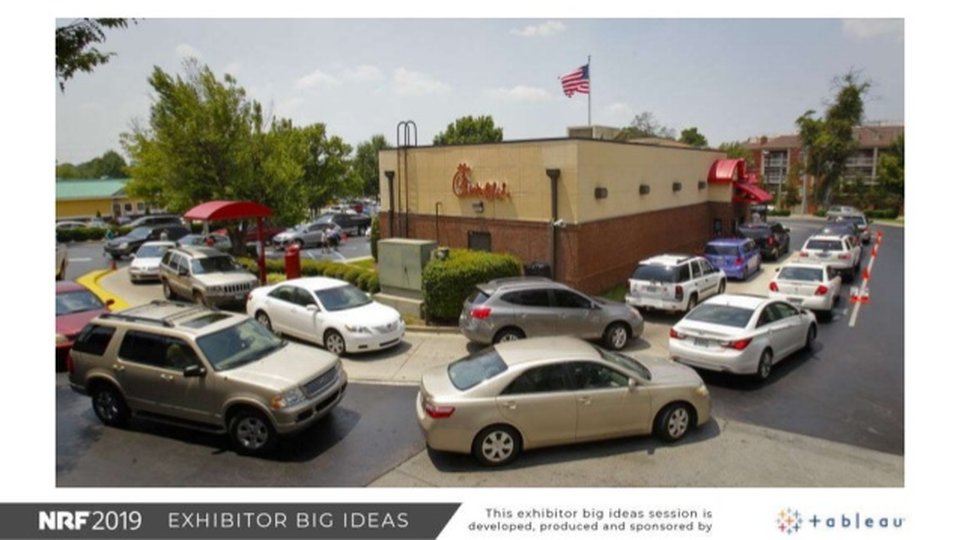
Such a data-driven strategy is key as Chick-fil-A is focused on customer service and speed of service.
Hinson offered an example of how real-time data is driving a better customer experience. Chick-fil-A locations have small mini-fridges under cashier counters for quick access to menu items. But many times the intended time-saving aspect of grabbing something quickly didn't work out because location operators weren't sure how much of product would be needed on a daily basis.
A data analysis of what is needed (for example, juice for morning customers, salads for lunch customers) drove a new strategy in stocking product. That's made cashiers' jobs easier and reduced customer order wait time.
"The technology we are using lets us build, update, engage and foster a community of analysis and lets leaders and store managers share tips and tricks, best practices," said Hinson.
About Judy Mottl

Related Media
Subscribe
Get the latest news and resources from Retail Customer Experience.
Recent Posts